
As you could read in our previous blogpost, our amazing artists have done an impressive job polishing up the graphics for the release of our demo. After improving graphics, we had to make sure unity could actually show them on most systems at an acceptable frame rate. So, after losing all our frames to detailed models and fancy postprocessing effects, we had to win them back. Luckily there is a nice tool to help you with just that: the profiler.
The profiler
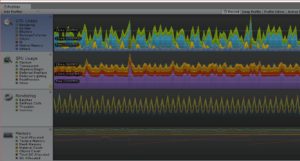
Even though several Unity webpages still say it is only available in the Pro-version, the profiler is also available in the personal edition. Hidden behind the window button, it opens a nice look into the heart of your game. You may be familiar with the small stats in the editor, that already shows you some nice information. The profiler is that stats-window on steroids. When you first open it up it will look disappointingly empty. It’s when you run the game in the editor with the profiler open that all the magic happens. Unity will spit out a stream of data on several aspects of the game: CPU, GPU, Memory, Physics, even networking. If you don’t see a particular one you might have to add it by clicking Add Profiler. Each one is subdivided in different categories, shown each with a different color in the graph. Clicking any of the aspects gives you more detailed information in the lower half of the window.
Optimizing
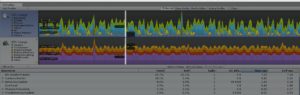
When optimizing there are two main targets: CPU and GPU. Memory and possible network issues must not be forgotten, but are usually not that critical. When selecting the CPU Usage, we get the Hierarchy Overview. This table shows all processes and functions eating up your precious CPU milliseconds. It shows how long each one takes, how much percentage of the total time that represents, and we can open them up to split the functions out even further. Here you can hone in on your expensive functions and try to optimize your scripts. We use a spline as the bases of our tracks, and determining where the player is on the track turned out to be a very inefficient function. So rather than calling it 5-6 times, we only call it once every frame, and we might even lower that depending on where the player is. This way we won several frames.
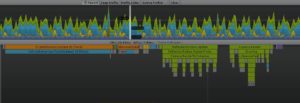
If the Hierarchy view is not your thing you can also swap to the awesome TimeLine view, where all the functions are shown chronologically. You can also take a look at the different thread uses there.
Two functions you might see coming back quite often are Camera.Render, which is all the work done on the CPU linked to rendering the scene, and Gfx.WaitForPresent. This last one is the time the CPU must wait for the GPU to finish rendering the frame. If you see this turn up, you know your framerate is GPU bound. You can also see this in bar above the detail view, where both CPU and GPU time are shown. There is no point in focusing on optimizing the CPU further if the GPU is already taking twice as long. If the Camera.Render is costing you dearly, take a look at batching to reduce the overhead on the CPU.
GPU
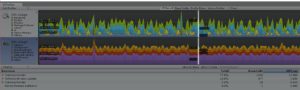
Clicking on the GPU Usage shows in detail which part of rendering the frame takes how much time and how many draw calls are needed. Even more interesting is the Frame Debugger, which can be opened if you are standing on the current frame. It will show step by step how the frame is build up in the scene view. This way you can get some insights into what Unity renders and which objects are batched together and drawn in the same DrawCall.
To optimize the GPU we have several options. Look into occlusion culling, and cull distances to draw only what you need, use LOD’s to reduce the number of vertices to GPU needs to handle, bake lights and shadows where possible and set up your levels intelligently.
Also, try to figure out if you are limited by fillrate, or by memory bandwidth. If the game runs much faster at lower resolutions, you will be limited by fillrate, the amount of pixels that can be rendered per second. How to solve it, I don’t know yet, as we are still trying to improve on the GPU. We did do some tests with rendering the scene to a texture and showing the texture full screen. Even though this causes some more overhead, reducing the texture resolution improves the framerate significantly. We might try to create a type of dynamic resolution scaling with this technique, or look into a more ingenious approach. The first results were promising in any case.
I hope some off you reading this can use it to improve the frame rate of your own games, and if you have tips and tricks of your own please let us know in the comments.